Optimised Shelf Space
Understand exactly how your products are positioned vs the category. Identify the gaps between what was agreed, your performance and what is actually on shelf.

Instant full visibility into every store from Bergen to Barcelona.
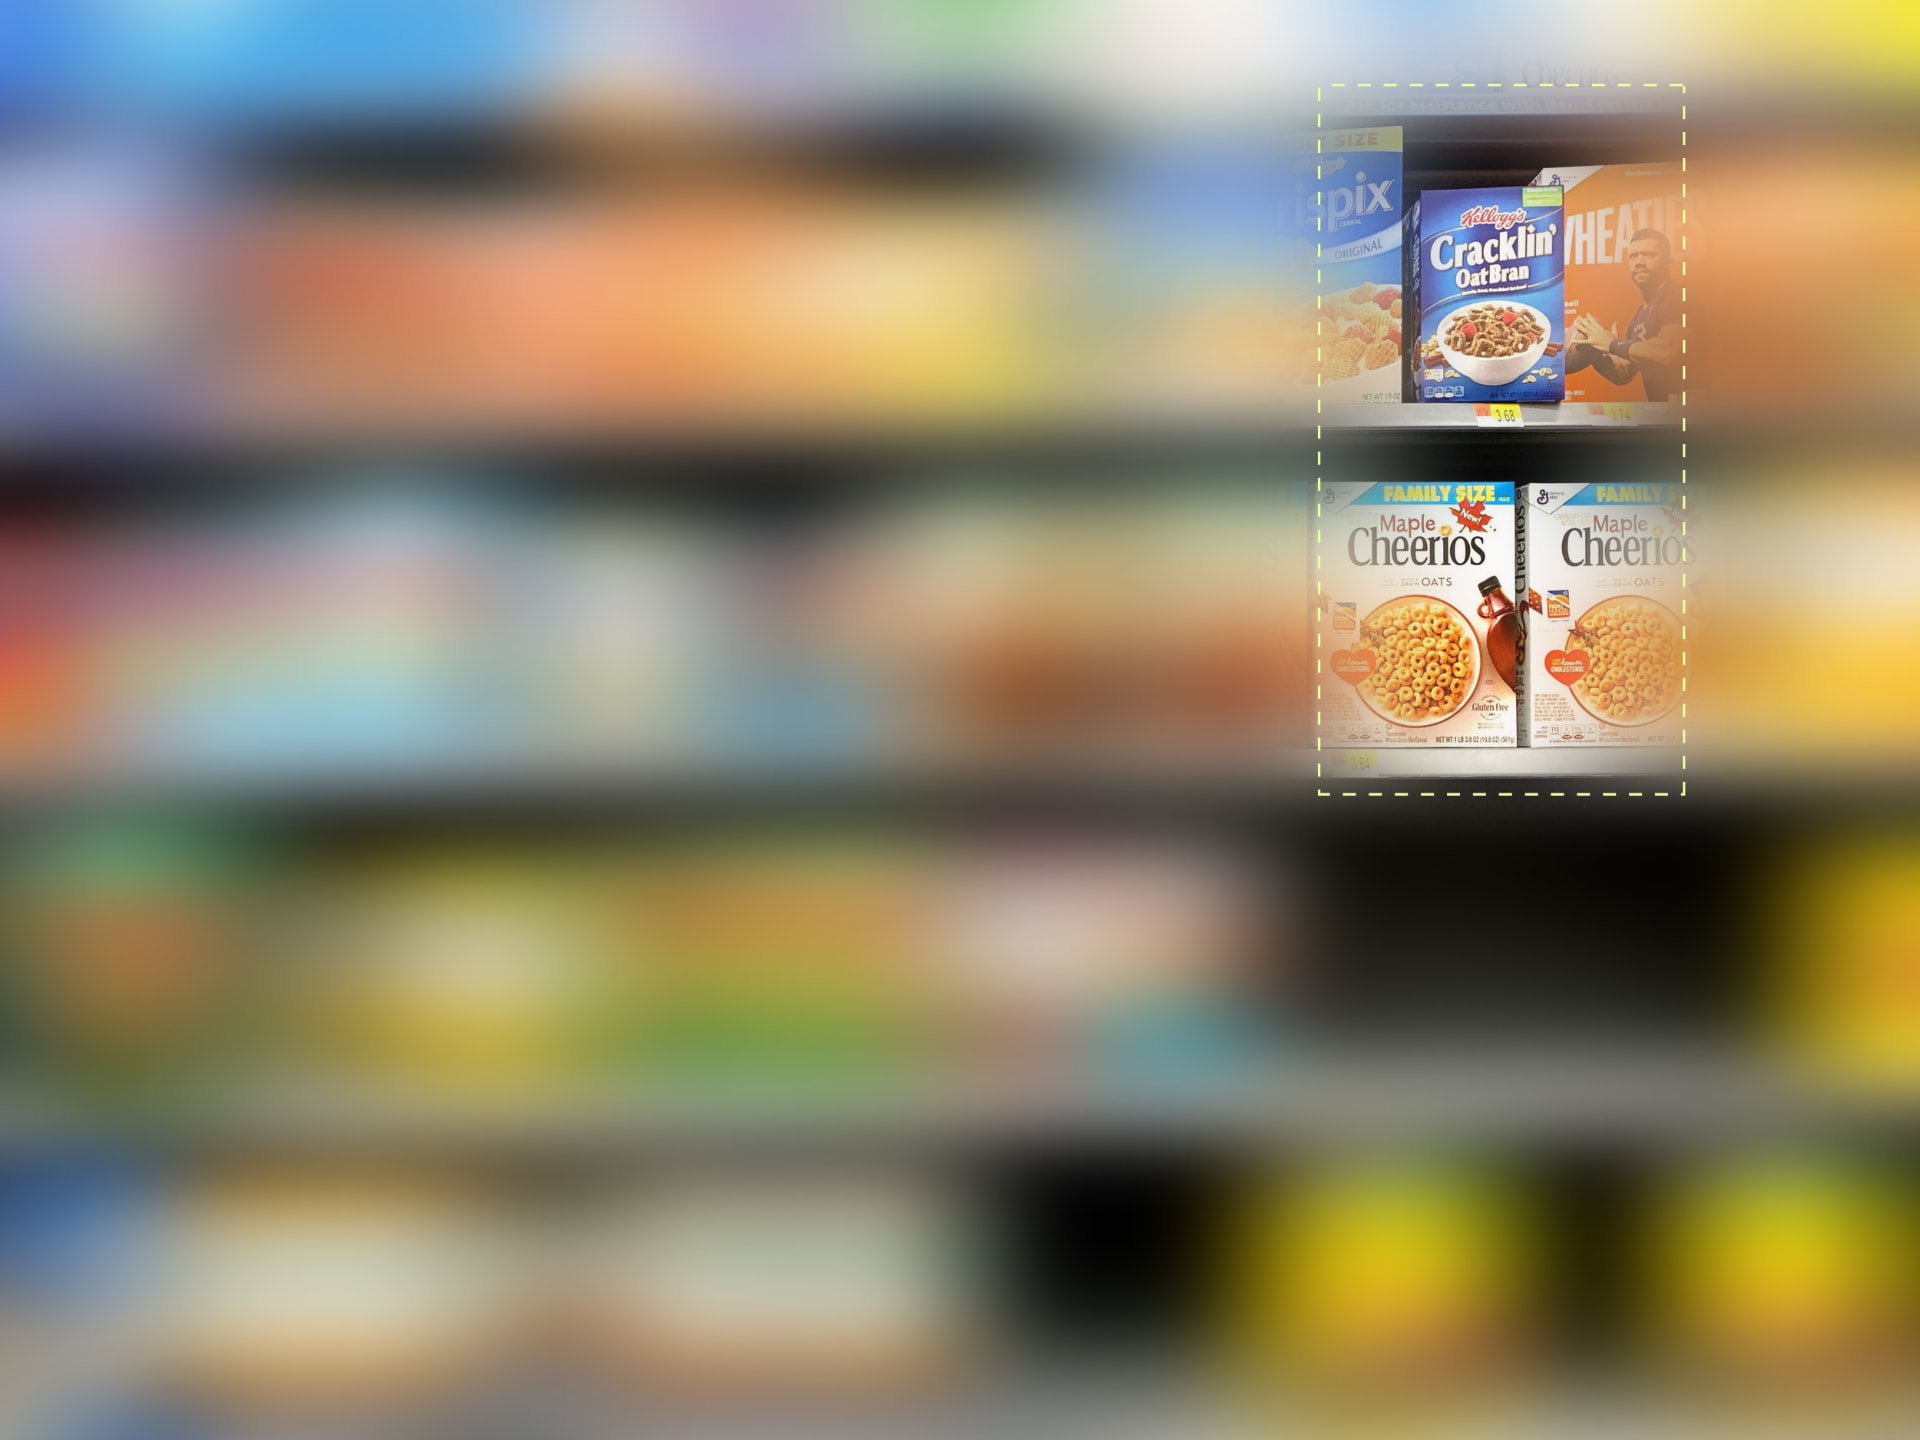
Anyone with a phone can capture a shelf. Ravogen's AI recognises every product, facing and price, and turns it into structured data you can actually use. No special hardware, no manual counting.
When you can see what's happening on your shelf in real time, across every store and every market, decisions that used to take weeks happen in hours. Our goal is to provide actions that help you sell more.
Understand exactly how your products are positioned vs the category. Identify the gaps between what was agreed, your performance and what is actually on shelf.
Sales reps walk into every conversation with shelf data from that store, that day. They negotiate better placement with evidence, not impressions.
Shelf price labels captured automatically at every visit. Monitor price deviations, promotional compliance and competitive positioning across chains.
Set assortment goals at SKU level for every store. Sales reps get automated alerts on missing items the moment the shelf is photographed, so gaps get fixed before they leave the store.
Every photo captures the full shelf, not just your products. Track competitor share of shelf, pricing and placement changes.
Ensure store compliance by tracking price and shelf execution. Compare against store performance to take promotions to the next level.
See every store across your field: store, chain, region, country and field sales agent, with visit date and time.
See how much shelf space each brand and product has: facings per SKU, length, height and area.
See where the space is on the shelf: width and height coordinates, eye-level zone and non-eye-level placement.
See which shelves products occupy: the primary category shelf, register, end-cap, island or promotional bin.
See the brand blocks: vertical or horizontal strategy, neighbouring brands, block size and number of blocks.
See which products are missing, including identified missing SKUs and empty space where the SKU cannot be determined.
See the shelf price of every SKU, captured from the visit images.
See all your products and competitors’ products: category, subcategory, SKU name, EAN, vendor and brand.
A low-commitment pilot on one category, over two months. See the data on your own shelves before deciding anything larger.